Denkplan © – The impact step
Prerequisites
To visual transparent communicate a strategy one prerequisite makes sense – some kind of strategy. That might sound funny, but from my experience working with many companies that point is somewhat vague. Either the strategy is confidential (i.e. only top management is authorized to view the uncensored version) or it is just in rework and available in – let’s say – six months or – and that happened to me in reality – the COO just could not find the current version on the intranet, only the version from 2015 that is not valid anymore. Whatever, siting side by side with my contact in a company I often ask out of the blue “by the way, can you show me where I can find and read the strategy of your company”. It is a good test.
What would a sound strategy look like? There are so many different representations of a strategy – the best starting situation is that – whatever representation exist – it is transparent and communicated within the company. The typical representation is a PowerPoint holding the vision / mission statement, the companies SWOT analysis, a wish list of products, services, features and/or capabilities underpinned by a phrased ambition how to develop these items over time. That might be a good start, although many strategies still are very company focused instead customer focused. In case the strategy is a carved in stone as a milestone plan for the next five years, with a tight budget plan signed by the board of directors, well, in this case we should expect a hard start and many impediments when trying to evolve customer focused and agile….
But let’s think positive: we have some representation of a strategy as starting point. We found the current version of the PowerPoint on the internet including the vision / mission statement and some bullet point lists with statements where the company will be in three to five years and why customer will be delighted by your future companies products and services.
Some theory behind the impact map
One thing is obvious: the bullet pointed strategy items in the presentation typically does not reflect all things a company must consider to make the strategy fly. In other words, the typical strategy definition does not reflect the full impact to the existing ecosystem. There might be some legacy systems that need to be replaced to be ready for digitalization. Probably we identify that we miss competences and therefore have to care for our staff members or find employees with new job profiles – including probably a mindset change all over the company working on the company culture. We must respect, visualize and work with all these influences and impacts, if we want our strategy to succeed. This is the playground of the first instrument: the impact map.
Identifying hot spots in the impact map
The impact map is based on the concept of a morphological box. A morphological box visualizes all relevant influencing factors and options of a specific system. To reach a desired goal with this system the factors and options are analyzed from three aspects: first whether a factor has an impact to reach the goal; second whether the factor is in good shape or requires improvement; and third dependencies to other factors that might require improvement as well because of the existing dependency. The influencing factors and dependencies between factors are marked typically using colors (for factors) and lines (to express dependencies). Such a combination of marked factors and the lines drawn between is called a context. A context is a consistent set of factors that require measures because they have an essential influence in reaching the desired goal.
The impact map as the company’s strategy map
Used to work on the company’s strategy, the impact map lists all the relevant and influencing factors and options of the company. This set is specific for each company, so it is part of the job to identify these factors and options and to configure the company specific impact map. Candidate elements are the target customer segments, existing processes, products, the IT systems implementing the products and services, the competences and capabilities of the company including the work force, the ecosystem like key partners and so on. All these factors and options maybe orthogonal, but heavily related. We say the impact map represents the map of the company. I hope you got that point.
When the impact map is configured, next step is to evaluate and analyze the state of the elements in the map against our vision and mission. Is it in good shape to reach our vision or do we have to work on that element? With this we identify the hot spots in the map. A hot spot can be a legacy IT system; a hot spot can be the long lead time to build and offer a new customer service in appreciated quality; a hot spot can be the cash cow product on the downgrade that generates high maintenance effort; a hot spot can be that we have problems to hire specific experts on job market.
To improve a hot spot – an element in the map – typically this element has dependencies to other elements in the map. Consequently, we have as well to work on these other elements because of the inter-dependencies of the elements. For example, if we want to improve the company’s customer focus, we have probably as well to improve marketing and customer service.
Identifying a context of action
Analyzing the map, we identify a context of related elements, visualizing the context by drawing lines between inter-related elements and marking the elements in bad shape. We can as well identify more than one context in the map. A context describes a goal impact relationship. Let’s say it in this way: “If we want to improve X and Y in this way to make a step towards our vision, we have as well to work on A, B, C and D.”
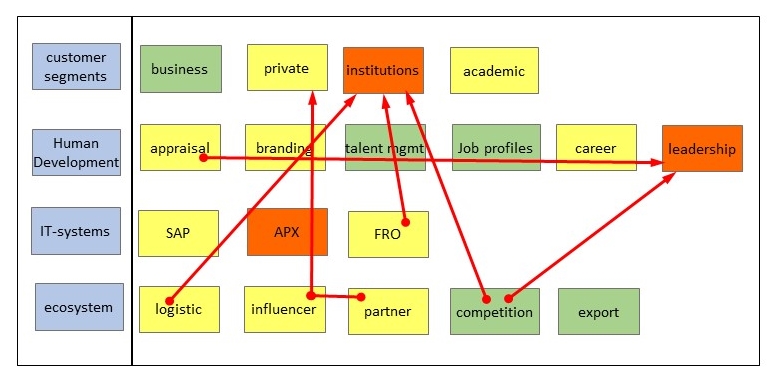
Example of an impact map (without themes)
The result of this analyzing step is a set of contexts. Now it is time to think what we must change and to work on. Analyzing the contexts, we identify and derive measure. These measures typically can be grouped into themes of strategic relevance. What themes we derive while analyzing the contexts is again dependent on the company, the vision and the surrounding ecosystem. Examples for themes can be: a new “omni channel self-service offering” for our customers; or an organizational theme like “we want to be under to top three employers in our domain”; a theme might be “our ICT architecture must be re-structured for digitalization”. From our experience a good level of discussion and strategy visualization is something between seven to fifteen themes. Surprisingly this number is independent from the company size – the difference is the abstraction level of the identified themes. This number of elements is appropriate for visualization and communication.
The identification of themes is the transition to the next instrument – read more in upcoming blogs.
Denkplan © and the concepts behind is a registered trademark of DoD!fferent GmbH, Saraes Media GmbH and Juropera GmbH.
 Previous Post
 Next Post